What came out of it?
The canvas prototype
Below is the live, interactive xFigura canvas prototype.
Finding the dots
Product Understanding
Four product layers

Canvas-Based
Interaction
The spatial workspace where users drop, arrange, and wire text, image, video, and 3D preview nodes.

Infrastructure
Layer
The desktop-to-cloud data pipeline managing the Rhino plugin, parameter inputs, Speckle integration, and the Revit connection.

Model
Marketplace
The backend aggregator engine that routes and processes third-party and proprietary models, including Flux, upscalers, and the Nano Banana suite.

Human Connection
Layer
The multiplayer environment hosting markup tools, team collaboration features, and text annotations for design redlines.
Early Design Development
Baseline workflow primitives

Massing &
Adjacencies
The geometry block handling spatial logic, bubble diagrams, volumetric configurations, and programmatic layouts.

Surface &
Materiality
The tactical block handling tectonic properties, surface textures, roughness, porosity, and material specifications.

Environmental
Values
The contextual data block tracking solar orientation, azimuth angles, time of day, and microclimate conditions.

Markup &
Discourse
The feedback block capturing sketch overlays, live review comments, annotations, and designer-to-principal team alignment.
Connecting the dots
Opportunities into UI
Active Focus: OP-1
Parametricizing
Text Inputs
massing+canvas+inframaterial+environAsync Context
Capture
canvas+inframaterialParametric
Visualization
canvasmaterial+environThe Core UI Elements & Interactions
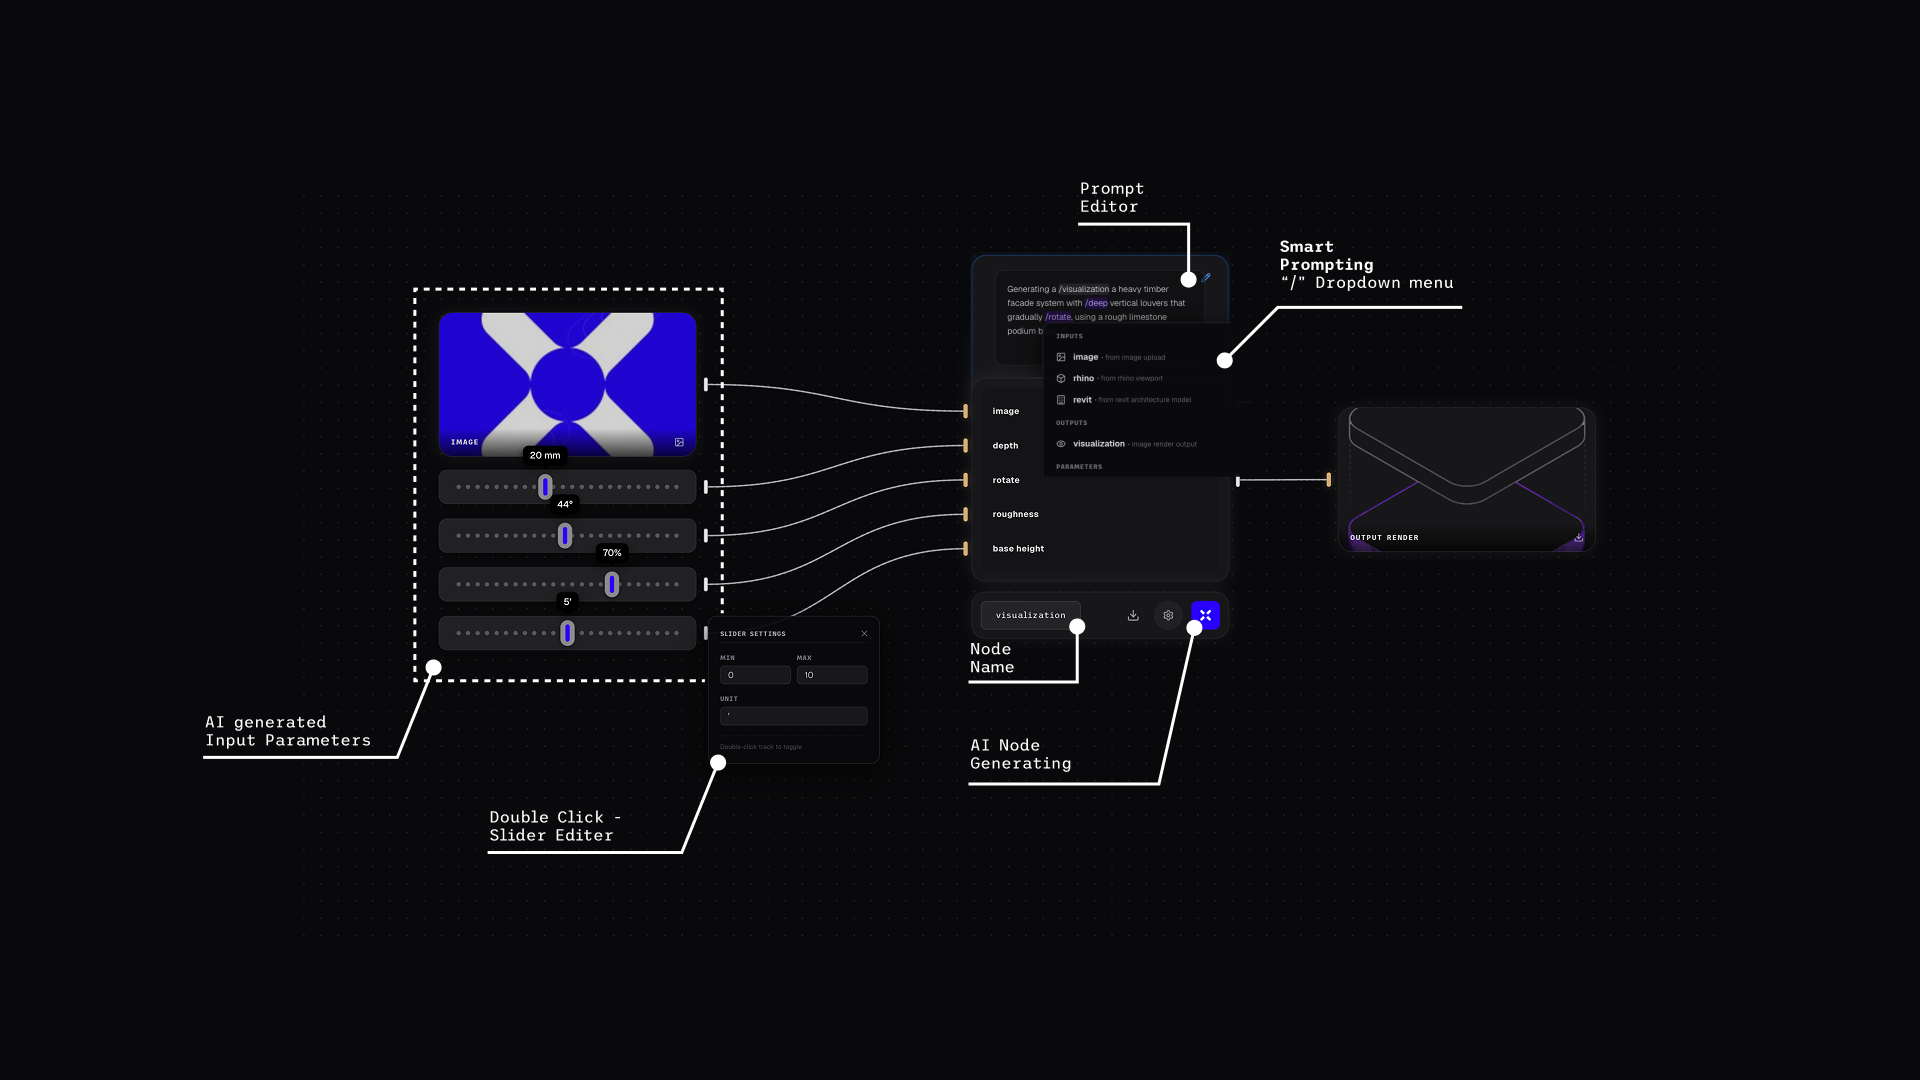
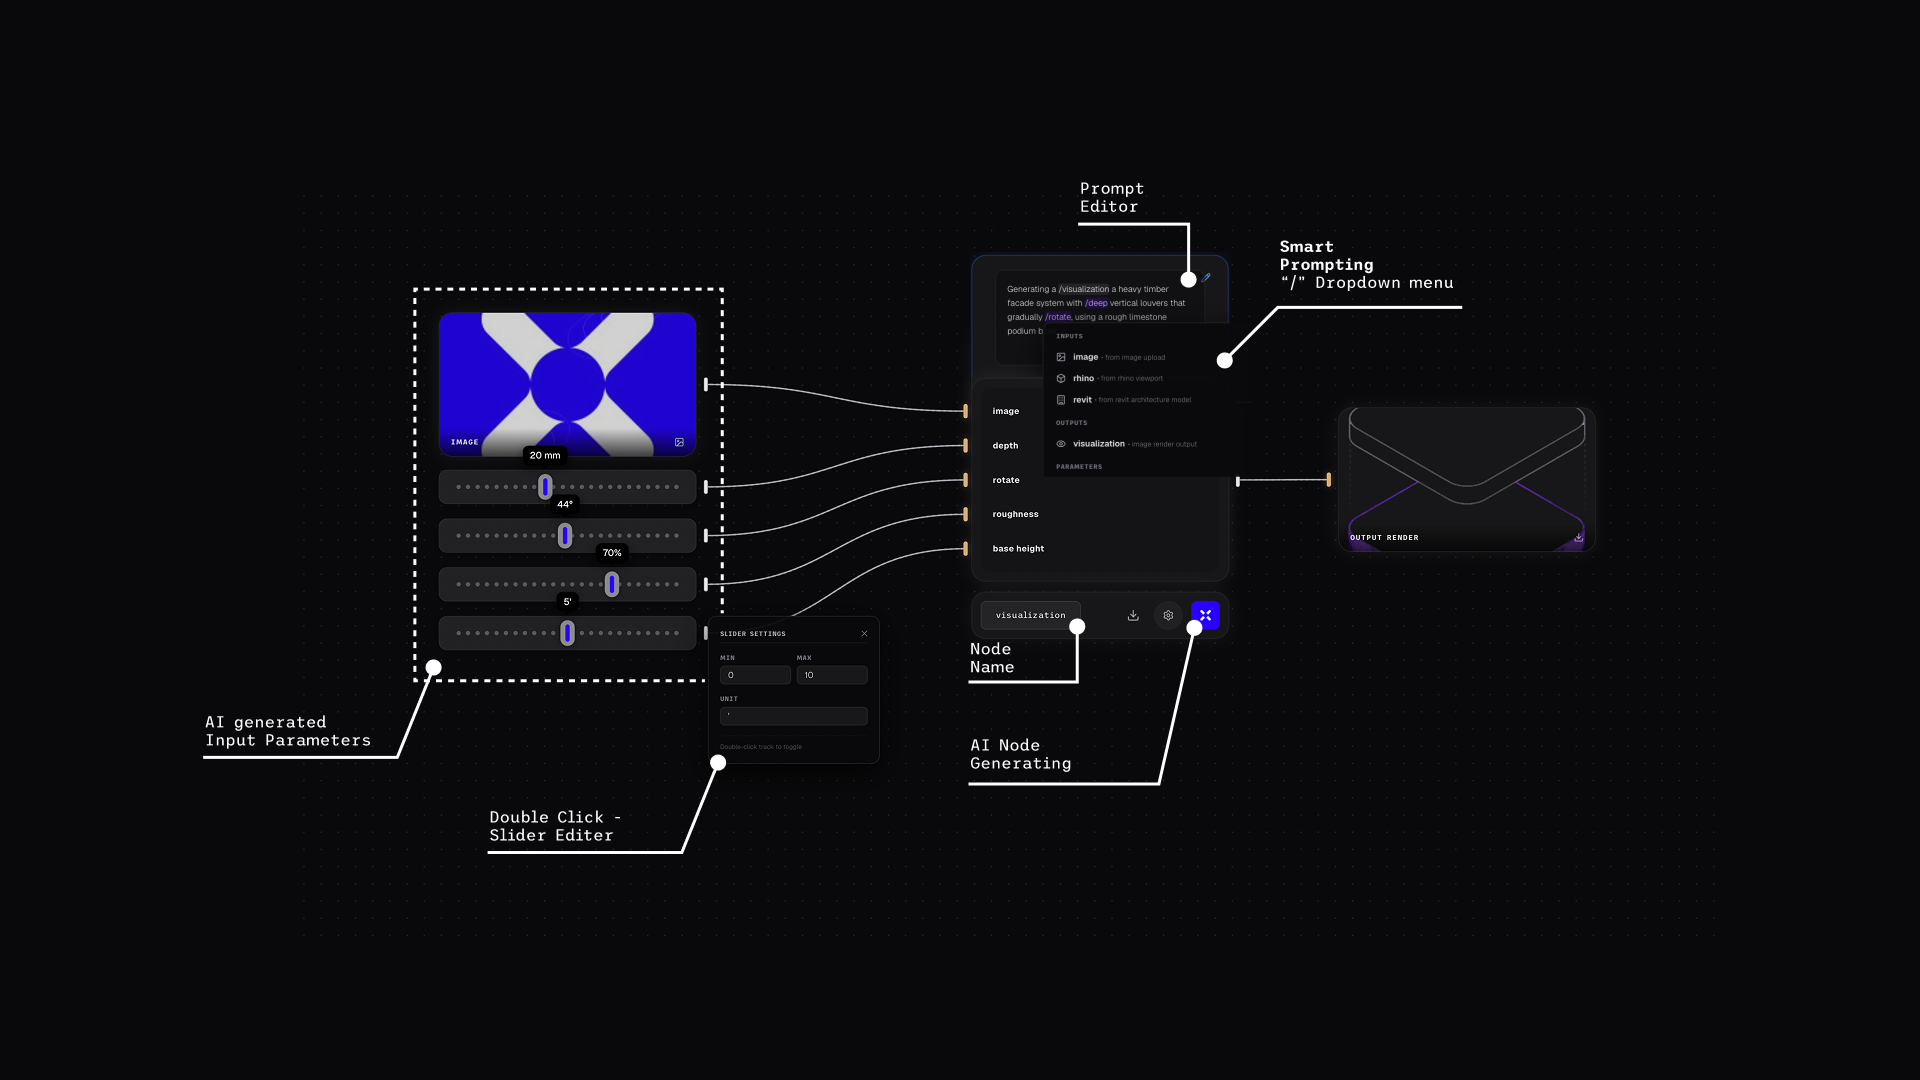
The text-to-node interface relies on three core UI components that work together across the layout canvas:
Source Text Node
The entry point on the left of the canvas where you type the prompt. It tokenizes terms like /visualization, /deep, and /rotate into active pills. Clicking Parametricize kicks off the graph generation.
Decoupled Parameter Sliders
Independent control cards that spawn on the canvas with clear 20px vertical spacing. They map the parsed variables into manual controls with direct numeric readouts (20 mm, 44°, 70%, 5’).
Main Generation Hub
The central parent card positioned in the middle of the workspace. It features visual input sockets on the left edge to receive data wires from the parameter sliders, a reference image dropzone, and a Generate Visualization button at the base to render the final preview node.